TechCut — Technical Case Study · AXONS Cost Production Platform Project
Ask most companies what their production costs are, and they’ll have an answer ready: average cost.
Average per ton. Average per lot. Average by unit output.
In many situations, average figures are good enough for a high-level view of the business.
But when the questions change from “What’s the average cost for this product group?” to:
“What’s the actual profit margin on this specific Job?” “Is it still worth continuing this Batch?” “Which Activity is causing costs to spike?”
Averages stop being sufficient.
Because in real production, not every Job consumes the same resources. Some Jobs pass through more stages, some Batches need re-processing, some items skip certain steps, and some costs carry over from previous cycles.
When everything gets averaged together, the business may see a picture that looks reasonable at a high level — but end up making wrong decisions at the operational level.
This was the core challenge at AXONS, and the reason Muze was brought in to design and build a Cost Production Platform — one that doesn’t just “calculate faster,” but fundamentally changes how cost is seen: from average-level visibility to Job-level accuracy that reflects how production actually works.
The Problem: Excel Wasn’t Wrong, But It Wasn’t Enough
Before this platform existed, AXONS managed production cost calculation in Excel.
That isn’t a criticism. Excel is a highly flexible tool, and it’s often the starting point for many important business processes inside large organizations.
But as production processes grew more complex, transaction volumes increased, data started flowing from multiple systems, and business logic accumulated more conditions — Excel began to become the bottleneck.
AXONS runs two distinct business units: Corn Seed and Chemical Fertilizer. Each has different production characteristics, different Activities, different cost flow paths, and their own set of specific conditions.
The challenge wasn’t just mapping data to the right formulas. It was making the system understand which production process and which Job each transaction belongs to — and how it should factor into the cost calculation.
1. Costs Were Averaged Across All Jobs
In the old system, certain cost types — labor, materials, overhead — were divided by total units produced. This gave a reasonable-looking aggregate number, but couldn’t reflect the reality of each individual Job.
A Job with more complex processing steps, requiring more time and resources, might be assigned lower cost than it actually incurred. A simpler Job might absorb a disproportionate share of the average overhead.
The result: the business might conclude certain Jobs were profitable when they actually weren’t.
2. No Way to Trace Cost Back to the Actual Job
The important question wasn’t just “how much did this cost in total?” — it was “where did this cost come from?”
If the system couldn’t trace back which Activity generated a cost, whether previous-period costs were being carried forward, or whether re-processing or skipped steps had occurred — the final cost figure could only answer “approximately this much,” with no ability to explain its origin.
And when you can’t explain where numbers come from, trust in those numbers erodes.
Core Insight: Costs Don’t Live in a Single Activity — They Flow
The heart of this platform isn’t replacing Excel with a web app. It isn’t automation for the sake of speed.
It’s a fundamental rethinking of how cost works.
In real production, one Activity rarely ends in isolation. The output of one Activity often becomes the input of the next.
If Activity A produces a semi-finished product, and Activity B uses that output to continue processing — then Activity A’s cost must be forwarded to Activity B. And if Activity C uses Activity B’s output downstream, the accumulated costs from both A and B need to flow through to C.
This is the principle we call Cost Forwarding by Dependency Degree.
Activity A → produces Output X
Activity B → uses Output X + other materials → produces Output Y
Activity C → uses Output Y → produces Finished Product

Cost of Finished Product =
  Activity C's costs
  + Activity B's costs (forwarded)
  + Activity A's costs (forwarded through B)
If the system doesn’t understand these dependencies, the final cost figure will be structurally wrong — not just mathematically wrong.
From Business Logic to Dependency Graph
For the calculation engine to produce accurate results, the production workflow’s business logic must be translated into a data structure the system can process.
The key concept is building a Dependency Graph — representing the relationships between Activities: which ones must be calculated first, which ones receive forwarded costs, and where in the production chain those costs should land.
On the engineering side, the system uses Topological Sort to determine processing order based on Activity dependencies — ensuring that upstream Activities are always calculated before the downstream Activities that consume their output.
System Architecture: 4 Modules
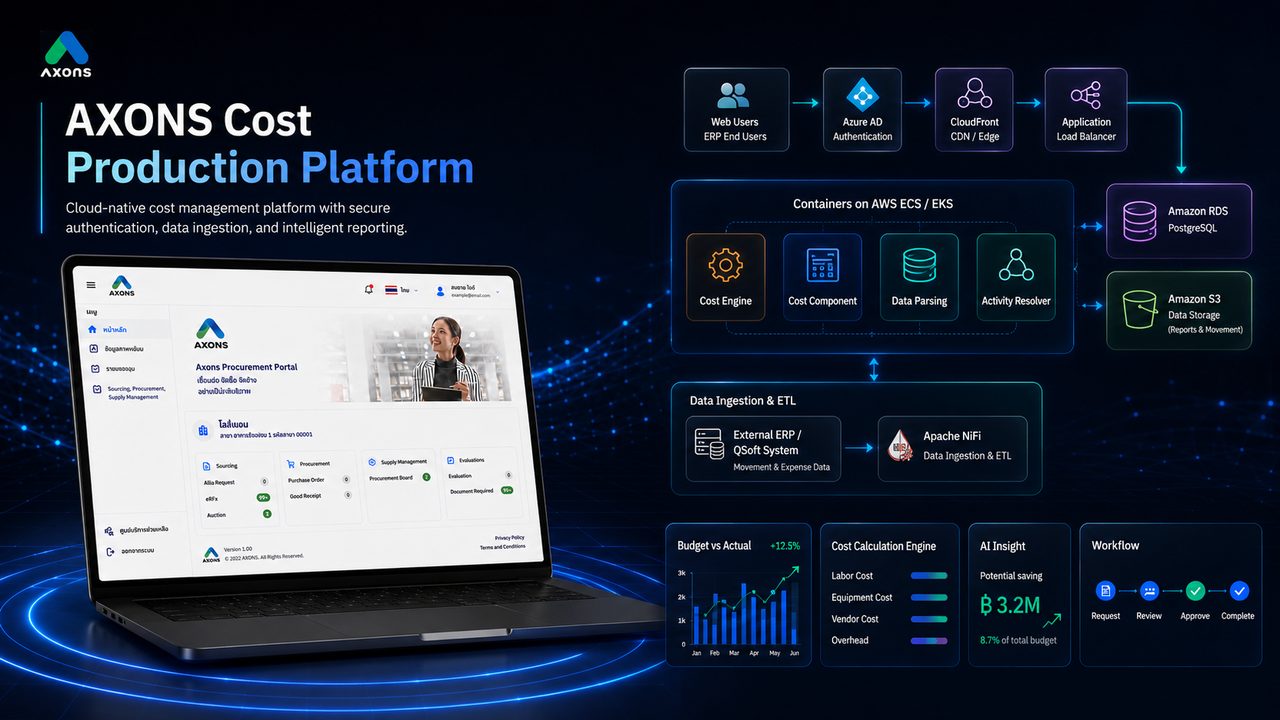
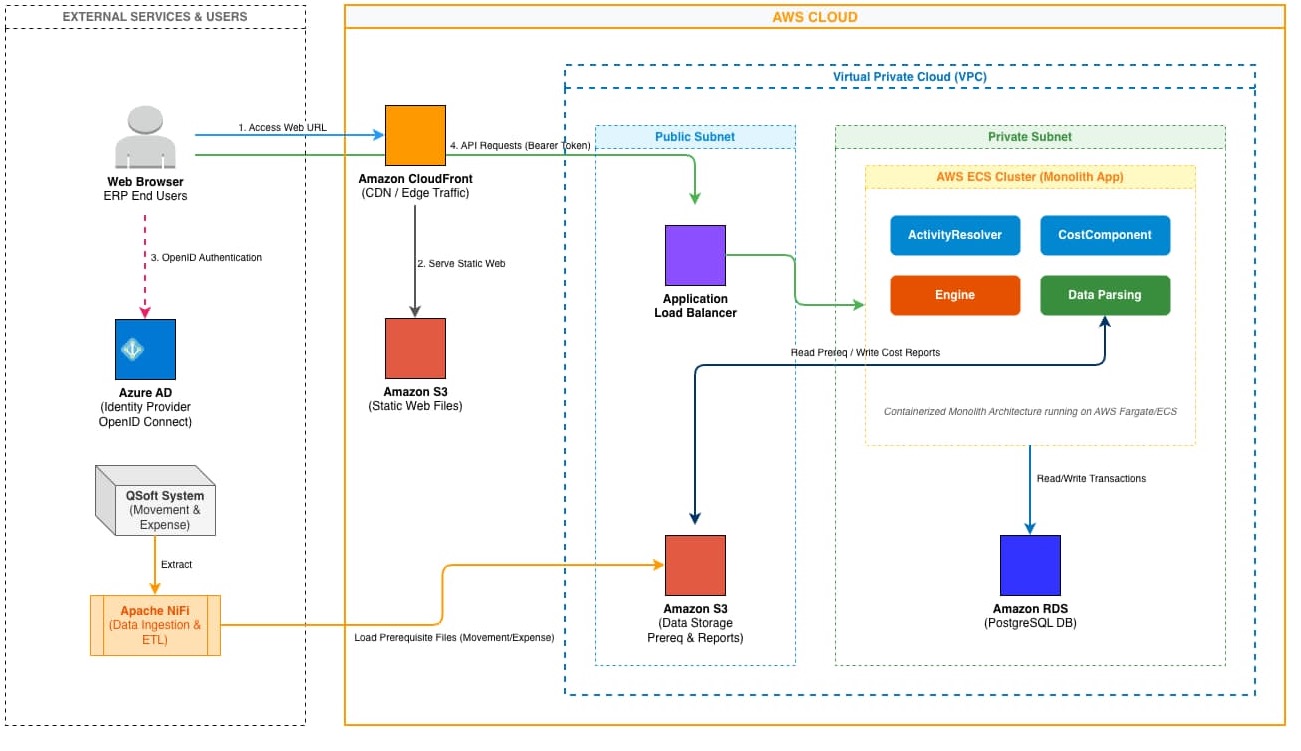
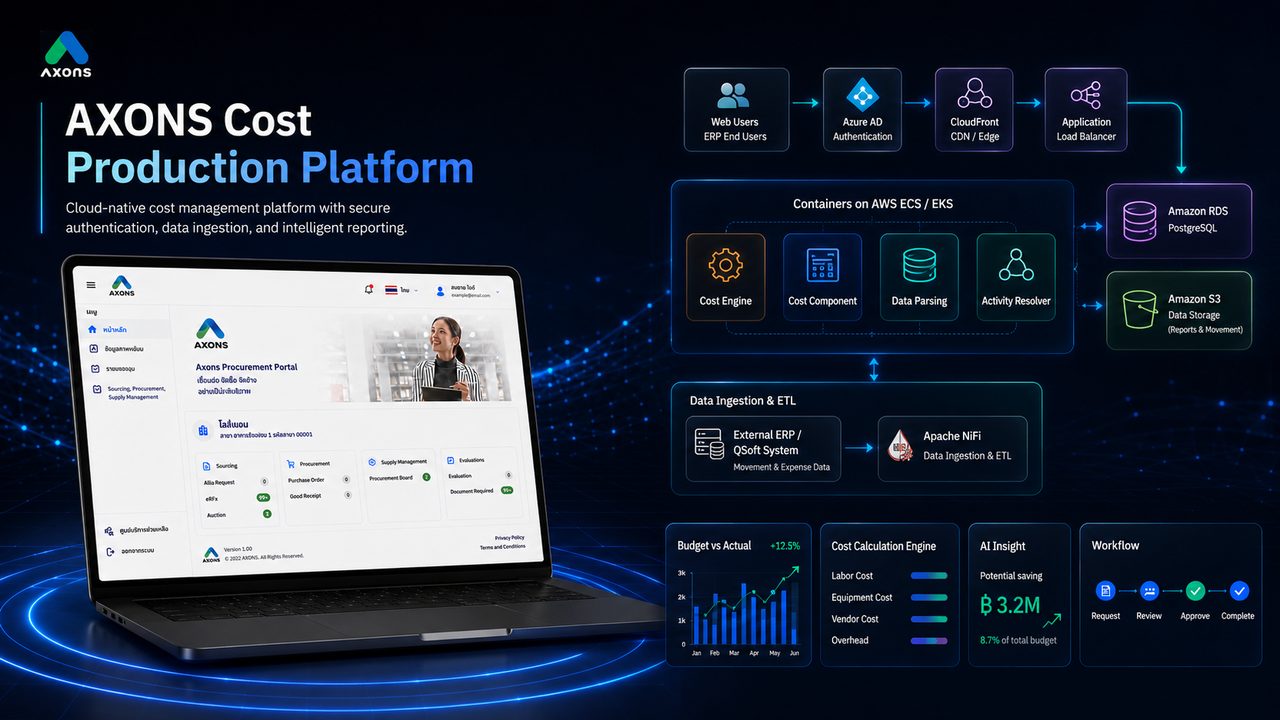
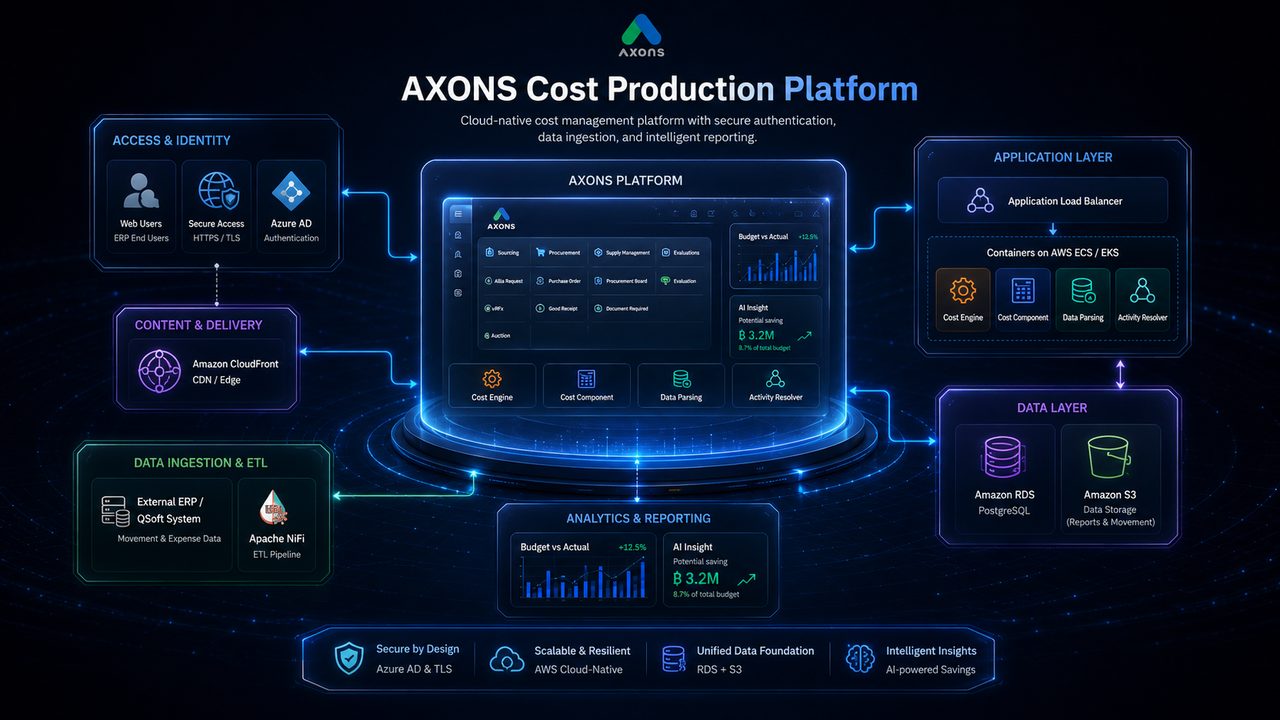
The platform is structured as 4 modules working together — from ingesting data from the existing ERP system, all the way to calculating final costs at the Job level.
Module 1: Data Parsing
This module receives data from QSoft via an ETL pipeline (Apache NiFi) and transforms it into a format the new system can process — including stock transactions, expense line items, production records, and Job/Batch data for each production cycle.
Data Parsing isn’t only about format conversion. It includes validation before data enters the calculation pipeline, because if source data is wrong at this stage, every calculation downstream will be wrong too.
Module 2: Activity Resolver
Once data is parsed, the system must interpret raw transactions into Activities that carry meaning in the context of production.
Questions this module answers: Which Activity does this transaction belong to? Which Job? Which business unit? Is this a current-period cost, or one carried forward from a previous cycle?
The Activity Resolver requires the deepest business logic understanding of any module — because raw ERP data doesn’t always communicate business meaning straightforwardly. Transactions that look identical may have different meanings depending on the business unit, the production stage, or the Batch status.
Module 3: Cost Component
Once the system knows which Activity each transaction belongs to, the next step is grouping costs by type:
- Material — raw materials used in production
- Labor — direct labor costs
- Overhead — factory operating expenses: electricity, water, depreciation
- General Expense — shared costs allocated according to defined logic
Separating cost components matters because the business doesn’t just need to know “what did this cost in total?” — it needs to know “what was this cost made of?” This transforms the platform from a calculation tool into a production performance analysis tool.
Module 4: Cost Calculation Engine
The core of the system. This engine receives the Dependency Graph, Cost Components, and cost-forwarding business rules simultaneously — then calculates costs in dependency order and forwards them according to the Cost Forwarding Logic.
The final output is actual Job-level cost, not just an aggregate average.
Tech Stack
| Layer | Technology |
|---|---|
| Front-end | Next.js 14 + Tailwind CSS + Zustand |
| Back-end | NestJS + Mikro-ORM + TypeScript |
| Database | PostgreSQL + Redis (Cache & Queue) |
| Infrastructure | AWS ECS / EKS + S3 + CloudFront |
| API Gateway | Kong API Gateway |
| Authentication | Azure AD (OpenID Connect) |
| ETL | Apache NiFi (QSoft → AXN-CPP) |
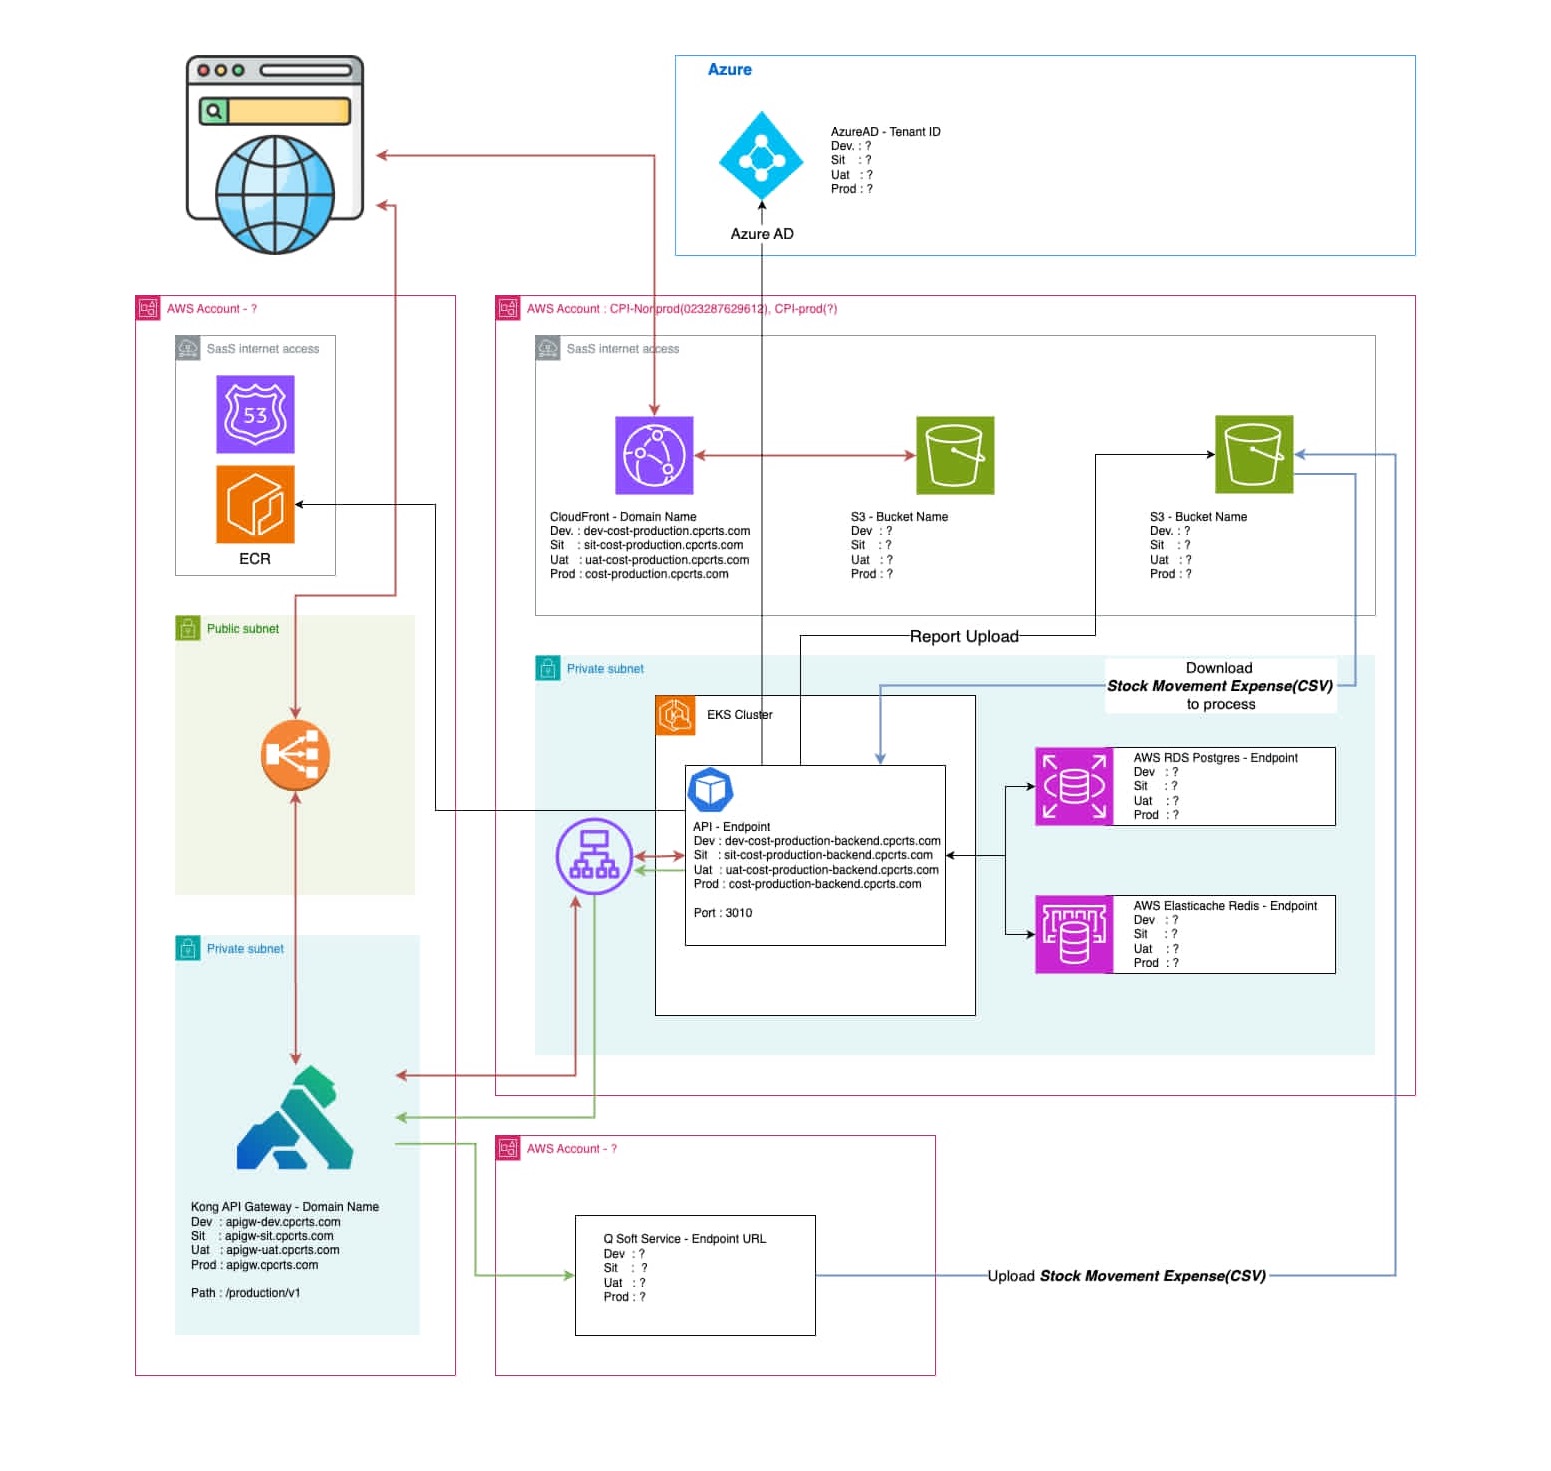
From ECS Monolith to EKS
The system can start as a Containerized Monolith on AWS ECS, grouping all 4 modules together. This is well-suited for early stages where deployment and management simplicity matter most.
As the system grows and different modules develop distinct scaling needs, the architecture can evolve to an EKS-based setup with Kong API Gateway, allowing each service to scale independently.
This is a practical approach for many enterprise systems — you don’t need to start with complex microservices on day one, but you do need to design with a clear path forward as scale and complexity grow.
Special Scenarios That Aren’t Edge Cases
A good cost calculation system must handle more than the happy path. In real production operations, these scenarios are routine.
Re-process
Some Batches must cycle back through a previous process — QC failure, or upstream results not meeting conditions.
In these cases, the re-processing costs must be recorded and correctly attributed to that Batch’s total cost. The system needs to understand that re-processing is part of that Batch’s journey, not an unrelated standalone transaction.
Skip Process
In some cases, a Batch may skip certain production steps due to raw material conditions or specific production flow requirements.
This sounds simple, but in a system with complex dependencies, skipping a process affects the Dependency Graph and cost-forwarding logic. The system must be able to adapt the graph to match what actually happened — not force every Batch through the same standard flow.
BF Cost: Brought Forward Cost
Some costs originate from a previous period — materials purchased last cycle but used in the current one, or semi-finished goods produced earlier and processed further now.
The system must clearly separate BF Costs from Current Period Costs — both for accurate reconciliation against accounting data, and so the business team can understand what proportion of current costs came from present-period activity versus what was carried from the past.
Results: Faster Calculation, More Trustworthy Decisions
One visible result: calculation time dropped from roughly 1 full business day per cycle to approximately 15 minutes.
But for this project, speed wasn’t the primary value.
The more important outcome was accuracy and confidence in the numbers.
When the business team asks “What’s the profit margin on this Job?” — the system can give an answer with a traceable origin, not just a figure extrapolated from averages.
When the team needs to decide which Batch types to continue, or which processes need improvement — the system can drill down to show exactly where costs are concentrated.
Moving from “we should be making roughly this much” to “this Job made exactly this much, and the cost came from these sources” is a change in the quality of business decision-making.
4 Lessons from Building This System
1. Business Logic Must Come Before Code
The Dependency Graph and Cost Forwarding aren’t just technical design decisions — they’re a translation of business logic into a system. Without understanding the actual production process, without knowing which Activity affects which, the architecture you design may be wrong from the start.
In systems like this, code that runs correctly doesn’t mean the system is correct. Correct numbers have to start from correct business logic.
2. Data Quality Is the Foundation of Calculation Accuracy
No matter how sophisticated the Calculation Engine is, it can’t compensate for data that was parsed or resolved incorrectly upstream. Data Parsing and Activity Resolver are the most critical modules precisely because they’re the first gate — determining whether data enters the calculation system correctly or not.
3. Special Scenarios Are Business Reality
Re-process, Skip Process, and BF Cost happen regularly in every production cycle. A system that only handles the standard process may look great in a demo — but once it meets real operations, the numbers will stop being trustworthy. Good enterprise systems are designed around operational reality, not just happy paths.
4. Speed Is a Benefit, But Accuracy Is the Value
Reducing calculation time from a full day to 15 minutes is a genuinely good outcome. But if the faster numbers still don’t reflect actual costs, speed alone doesn’t create enough value. The real worth of this platform is enabling the business to trust the numbers — and actually use them to make decisions.
For Organizations Still Running Critical Logic in Excel
If your organization still uses Excel for something important and complex, that doesn’t mean you’re behind. Excel is often the best starting point — flexible, fast, and well-suited for testing business logic.
But when that logic starts driving significant decisions, when data grows larger, when more people need access, and when numbers need to be traceable — the question may not be “should we stop using Excel?” It may be:
“Which business logic in Excel is important enough to become a real system?”
For AXONS, the answer was production cost calculation — because cost figures aren’t just back-office data. They’re the foundation for decisions about profitability, production planning, and process improvement.
Summary
The AXONS Cost Production Platform is an example of a system that didn’t start from “what kind of software do we want?” — but from a deeper question:
“What numbers can the business not yet answer, but needs to?”
When the question is clear, the architecture becomes clear. The modules become clear. And the technology stack becomes the tool that makes the right business logic real.
This is Muze’s role as a Tech Partner: not just building systems that work, but helping organizations translate business complexity into digital platforms that enable smarter, more accurate, scalable decisions.
Muze helps organizations design and build Digital Platforms that connect Business Logic, Data Architecture, and Engineering — so technology doesn’t just function, but produces real business outcomes.